This method plots a bar plot which represents the distribution of the number of missing values (NA) per lines (ie proteins).
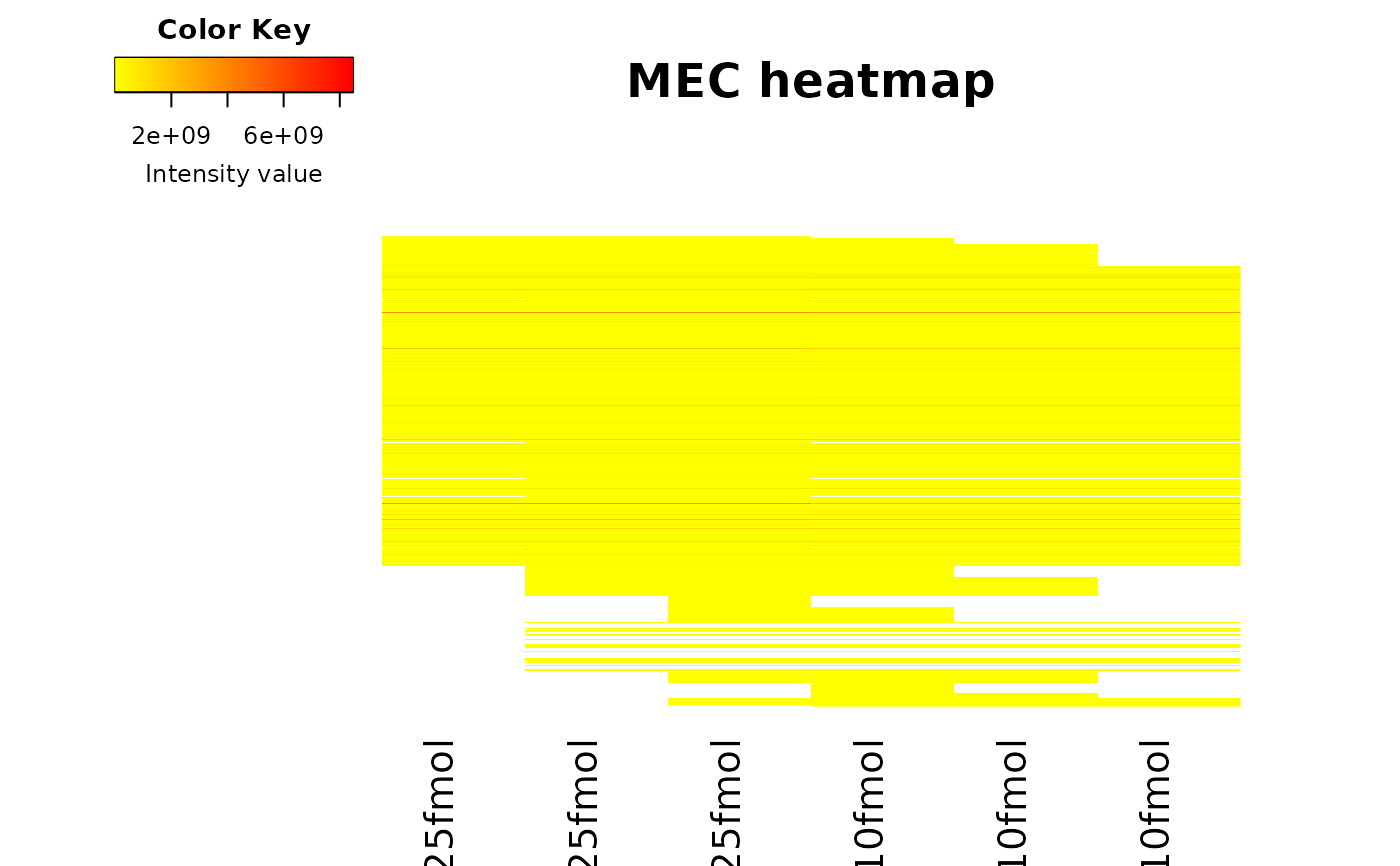
Plots a heatmap of the quantitative data. Each column represent one of
the conditions in the object of class obj and
the color is proportional to the mean of intensity for each line of
the dataset.
The lines have been sorted in order to vizualize easily the different
number of missing values. A white square is plotted for missing values.
#' Plots a heatmap of the quantitative data. Each column represent one of
the conditions in the object of class MsnSet and
the color is proportional to the mean of intensity for each line of
the dataset.
The lines have been sorted in order to vizualize easily the different
number of missing values. A white square is plotted for missing values.
This method shows density plots which represents the repartition of
Partial Observed Values for each replicate in the dataset.
The colors correspond to the different conditions (slot Condition in in the
dataset of class MsnSet).
The x-axis represent the mean of intensity for one condition and one
entity in the dataset (i. e. a protein)
whereas the y-axis count the number of observed values for this entity
and the considered condition.
Usage
metacellPerLinesHisto_HC(
  obj,
  group,
  pattern = NULL,
  detailed = FALSE,
  indLegend = "auto",
  showValues = FALSE
)

metacellPerLinesHistoPerCondition_HC(
  obj,
  group,
  pattern = NULL,
  indLegend = "auto",
  showValues = FALSE,
  pal = NULL
)

metacellHisto_HC(
  obj,
  group = NULL,
  pattern = NULL,
  indLegend = "auto",
  showValues = FALSE,
  pal = NULL
)

wrapper.mvImage(obj, group = NULL, pattern = "Missing MEC")

mvImage(obj, group)

hc_mvTypePlot2(obj, group, pal = NULL, pattern, typeofMV = NULL, title = NULL)Author
Florence Combes, Samuel Wieczorek
Samuel Wieczorek, Alexia Dorffer
Samuel Wieczorek, Thomas Burger
Samuel Wieczorek
Examples
if (FALSE) { # interactive()
data(subR25prot)
grp <- design.qf(subR25prot)$Condition
metacellPerLinesHisto_HC(subR25prot[[1]], group = grp, pattern = "Missing POV")
metacellPerLinesHisto_HC(subR25prot[[1]])
metacellPerLinesHisto_HC(subR25prot[[1]], group = grp, pattern = "Quantified")
metacellPerLinesHisto_HC(subR25prot[[1]], group = grp, pattern = "Quant. by direct id")
metacellPerLinesHisto_HC(subR25prot[[1]], group = grp, pattern = "Quant. by recovery")
pattern <- c("Quantified", "Quant. by direct id", "Quant. by recovery")
metacellPerLinesHisto_HC(subR25prot[[1]], group = grp, pattern = pattern)
metacellPerLinesHistoPerCondition_HC(subR25prot[[1]], group = grp, pattern = "Missing POV")
metacellPerLinesHistoPerCondition_HC(subR25prot[[1]])
metacellPerLinesHistoPerCondition_HC(subR25prot[[1]], group = grp, pattern = "Quantified")
metacellPerLinesHistoPerCondition_HC(subR25prot[[1]], group = grp, pattern = "Quant. by direct id")
metacellPerLinesHistoPerCondition_HC(subR25prot[[1]], group = grp, pattern = "Quant. by recovery")
pattern <- c("Quantified", "Quant. by direct id", "Quant. by recovery")
metacellPerLinesHistoPerCondition_HC(subR25prot[[1]], group = grp, pattern = pattern)
metacellHisto_HC(subR25prot[[1]], group = grp, pattern = "Missing POV")
metacellHisto_HC(subR25prot[[1]])
metacellHisto_HC(subR25prot[[1]], group = grp, pattern = "Quantified")
metacellHisto_HC(subR25prot[[1]], group = grp, pattern = "Quant. by direct id")
metacellHisto_HC(subR25prot[[1]], group = grp, pattern = "Quant. by recovery")
pattern <- c("Quantified", "Quant. by direct id", "Quant. by recovery")
metacellHisto_HC(subR25prot[[1]], group = grp, pattern = pattern)
}
data(subR25pept)
pattern <- "Missing POV"
pal <- ExtendPalette(2, "Dark2")
metacellHisto_HC(subR25pept[[1]], pattern, showValues = TRUE, pal = pal)
#> NULL
data(subR25pept)
mvImage(subR25pept[[1]], design.qf(subR25pept)$Condition)
 data()
pal <- ExtendPalette(length(unique(design.qf(subR25pept)$Condition)), "Dark2")
pattern <- "Missing MEC"
hc_mvTypePlot2(subR25pept[[1]],
group = design.qf(subR25pept)$Condition,
pattern = pattern, pal = pal)
data()
pal <- ExtendPalette(length(unique(design.qf(subR25pept)$Condition)), "Dark2")
pattern <- "Missing MEC"
hc_mvTypePlot2(subR25pept[[1]],
group = design.qf(subR25pept)$Condition,
pattern = pattern, pal = pal)