Performs a calibration plot on an SummarizedExperiment object, calling the cp4p package functions.
Source: R/DiffAnalysis.R
wrapperCalibrationPlot.RdThis function is a wrapper to the calibration.plot method of the
cp4p package for use with SummarizedExperiment objects.
Examples
data(subR25prot)
obj <- subR25prot
# Simulate imputation
obj <- NAIsZero(obj, 1)
obj <- NAIsZero(obj, 2)
allComp <- limmaCompleteTest(
SummarizedExperiment::assay(obj[[length(obj)]]),
design.qf(obj),
comp.type="OnevsOne")
wrapperCalibrationPlot(allComp$P_Value[, 1])
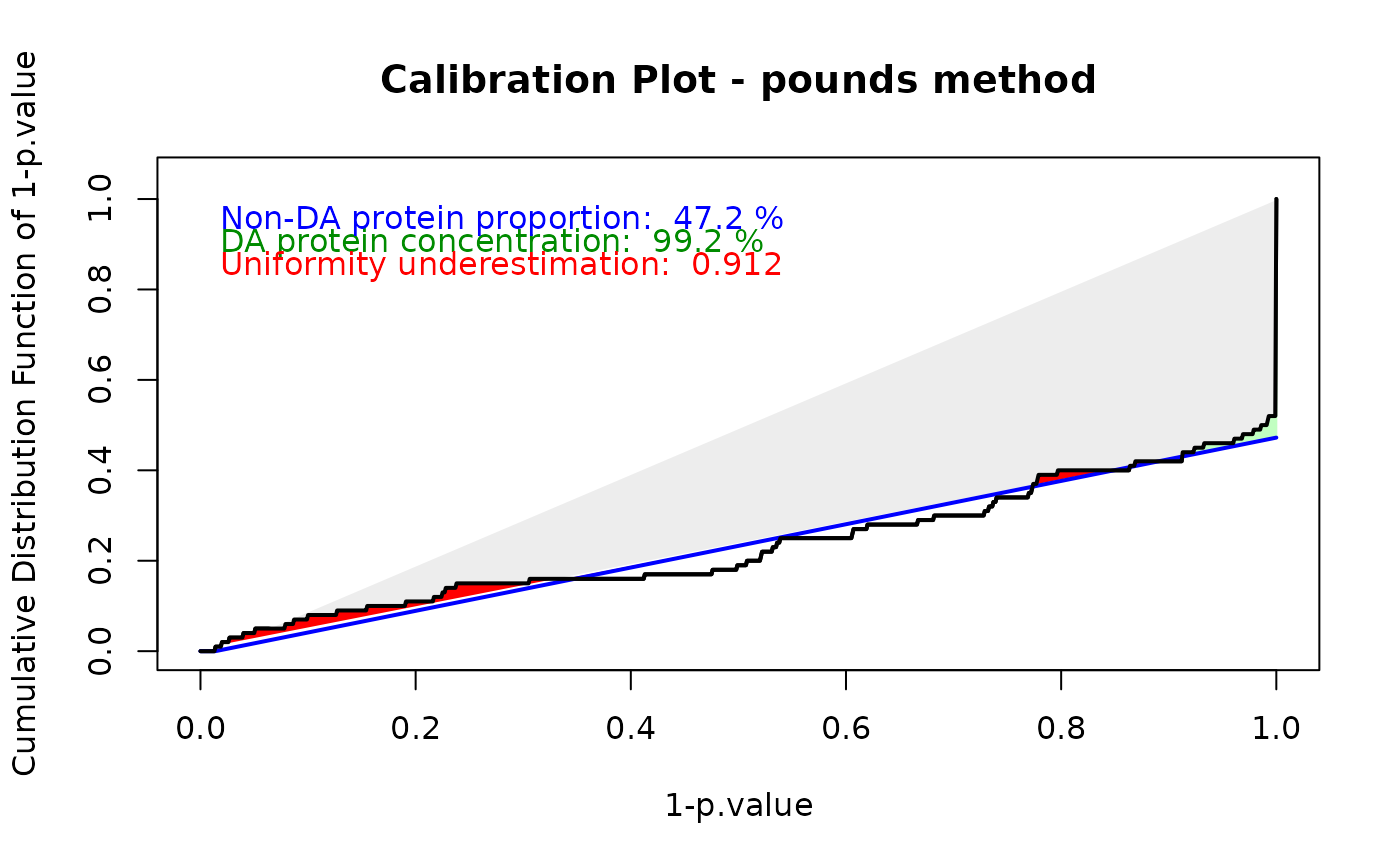 #> $pi0
#> [1] 0.4723159
#>
#> $h1.concentration
#> [1] 0.9926566
#>
#> $unif.under
#> [1] 0.9128457
#>
#> $pi0
#> [1] 0.4723159
#>
#> $h1.concentration
#> [1] 0.9926566
#>
#> $unif.under
#> [1] 0.9128457
#>