MagellanNTK user manual
Samuel Wieczorek
Manon Gaudin
Thomas Burger
February 27, 2026
Source:vignettes/MagellanNTK.Rmd
MagellanNTK.RmdAbstract
The R package MagellanNTK (Magellan Navigation ToolKit) is a workflow manager using Shiny modules. It is the perfect companion package to build workflows and integrate them in your UI or run it standalone.
Introduction
The package MagellanNTK is a Shiny application which
provides the infrastructure for the configuration, the execution and the
surveillance of a defined sequence of tasks. It builds graphical
workflow based on third party tasks, developed as Shiny modules.
This document covers the description and the use of the user
interface provided by MagellanNTK. It starts with a general overview of
workflows and their principles. Then, it focuses on the User Interface
of MagellanNTK.
For a more complete (and technical) information about MagellanNTK, it
is advised to see the Inside MagellanNTK.
MagellanNTK is not strictly speaking a workflow in the sense that it
do not provide any data analysis tool but it is a workflow manager which
offers many customization capabilities. It can deal with data structured
as MultiAssayExperiment and thus could be used to analyse
data from many domains such as Genetics, Epigenetics, Proteomics,
Single-cell Proteomics, ImmunoOncology, etc.
Main features
MagellanNTK is a highly configurable workflow manager that offers a
qualitative workflow manager and follows a simple but robust strategy.
It allows you to work with data in the MultiAssayExperiment
format as well as data derived from it (e.g., QFeatures).
As a result, it can process and analyze experimental data from a wide
variety of disciplines. MagellanNTK uses the data structure provided by
the MultiAssayExperiment package, which allows experimental
data resulting from a series of processes to be stored. The results of
the various data processing operations are added to the current dataset
so that a single result file contains the information from the entire
analysis.
UI for a single process
The pipelines used with MagellanNTK are plugins in the form of Shiny modules, whose code is stored in a directory specific to each pipeline. These plugins are added to MagellanNTK when the application is launched. The structure of these directories is described in the document ‘Inside MagellanNTK’. MagellanNTK can run either a complete pipeline (with all of its processes) or a single process. The latter option is useful for developing a new process or for faster, more targeted data handling.
One of the key features of MagellanNTK is its high degree of customization. To achieve this, Shiny modules are extensively used to simplify the implementation. A number of “Generic functions” are used in MagellanNTK to do some generic actions for a workflow manager, such as xxxx
There is a default implementation of these functions in the package
MagellanNTK itself but they also can come from plugins
containing pipelines, or from other packages. The choice of these
functions is specified in the configuration file (named config.txt) for
each plugin. In the example plugin provided in MagellanNTK, we see that
all these functions point to MagellanNTK functions (default value).
Discovering MagellanNTK
MagellanNTK is a R package which proposes a framework to navigate between steps of a complex data processing tool when the sequence of processes is mostly chronological.
For example, if a process is composed of three steps, then it is very easy to run the first step, then the second and finally the last one. It is like a dataflow manager.
Moreover, this navigation system, which is at the core of MagellanNTK, can be used at several levels. It is then possible to define, for example, a super-process (i.e. a pipeline) in which each step is a whole process containing itself several steps.
Pipelines, processes and steps
As any workflow manager, the aim of MagellanNTK is to
execute a series of ordered tasks over a dataset. The core of the
datamanager implements rules of navigation through the pipeline and
processes which ensure the quality of the whole analysis. This is
intended to guide the user through a validated statistical analysis
workflow.
In MagellanNTK, a process is defined as a data analysis process that performs a minimal and consistent set of operations (called ‘steps’) on a dataset. Each process has its own input object and returns an object as output.
In the MagellanNTK lexicon, a workflow (or pipeline) is a set of steps for processing and analyzing a dataset. Each of these steps (or processes) can also be composed of one or more sub-steps.
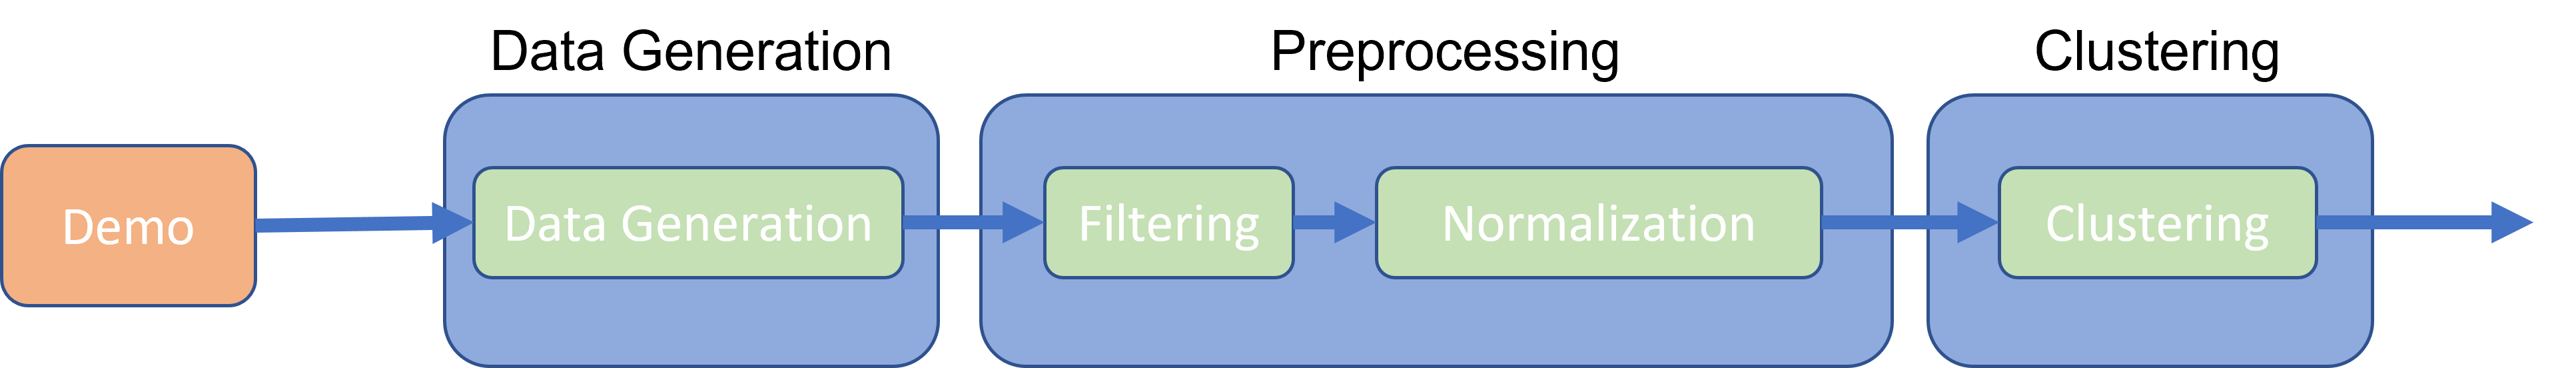
In the example provided with the MagellanNTK package,
the pipeline is called “PipelineDemo”. It contains 3 data processing
steps: DataGeneration (which contains 1 step), Preprocessing (with 2
steps: Filtering and Normalization) and Clustering (Fig.
@ref(fig:pipelineProcessStep)).
UI for a single process
The input and the output of a process is an instance of
MultiAssayExperiment (MAE) which contains one or several
SummarizedExperiment (SE). The dataset is processed through
a sequence of treatments (defined by the steps) in a classical way for a
workflow manager:
- The steps of a process can be represented as a directional graph with no no branches nor cycles. This ensures that the sequence of steps can only be executed in a predefined order.
- Each step takes the full dataset as input, but the treatment is performed on the last SE instance.
- The output of any step is the same dataset as the input, but with an additional SE which corresponds to the result of the operations made in that step.
By default, any step can be skipped during the process. So as to ensure the quality of the process and for mathematical reasons, we introduced a tag ‘mandatory’ to indicates if a step can be skipped or not. While a mandatory step is not validated, all subsequent steps are disabled. Once the mandatory step has been validated, all the following steps are enabled until the next mandatory one, if there is one.
The implementation of such features is made by mean of properties on steps. Actually, four tags refines the possibilities of a step:
Mandatory: indicates whether a task must be executed to be able to continue the workflow.
Done-Validated/Undone: indicates whether a step has been executed and validated. If the final step (‘Save’) of a process is validated, the MAE dataset is returned with an additional SE compared to the input. All features in the MagellanTK UI (Exploratory Data Analyzer, ‘Save as’) are updated with this new dataset.
Skipped: indicates whether a task has been skipped (i.e. it is not validated and there is at least one step further that has been validated). This is only possible with non-mandatory steps.
Enabled/disabled: indicates whether the task is executable (UI is enabled or disabled).
Each time a step is validated, a new SE is added to the dataset. This new dataset is then used as input for the following steps.
Timelines
Timelines are a graphical representation of the set of steps which compose the process and pipeline. Each node of the timeline is represented by a bullet with its name. The style of bullets (the fill color and the line) depends on the state of the corresponding step. For all states: * line style solid line for enabled steps, dashed line for disabled step * line color red for mandatory steps, grey for skipped step and black otherwise. * fill color empty color (white by default) for undone steps, green for validated steps
The available states are the following:
| Bullet | Property | State | Done/Undone |
|---|---|---|---|
| Mandatory | Disabled | Skipped | |
| Not Mandatory | Disabled | Skipped | |
| Mandatory | Enabled | Undone | |
| Mandatory | Disabled | Done | |
| Not mandatory | Disabled | Undone |
At any time, the current step is identified by an underline below the name of the step. The first step is always the current step at the beginning of a process (launch) and after the ‘Reset’ action.
In the case of a pipeline, the principle is the same. In the example in Fig. xxx, the pipeline called ‘PipelineDemo’ has four steps (Description, DataGeneration, Preprocessing and Clustering). Remark that the content of the UI area of the pipeline is exactly the whole UI of its current process (e.g. in Fig (Fig. @ref(fig:layout))).
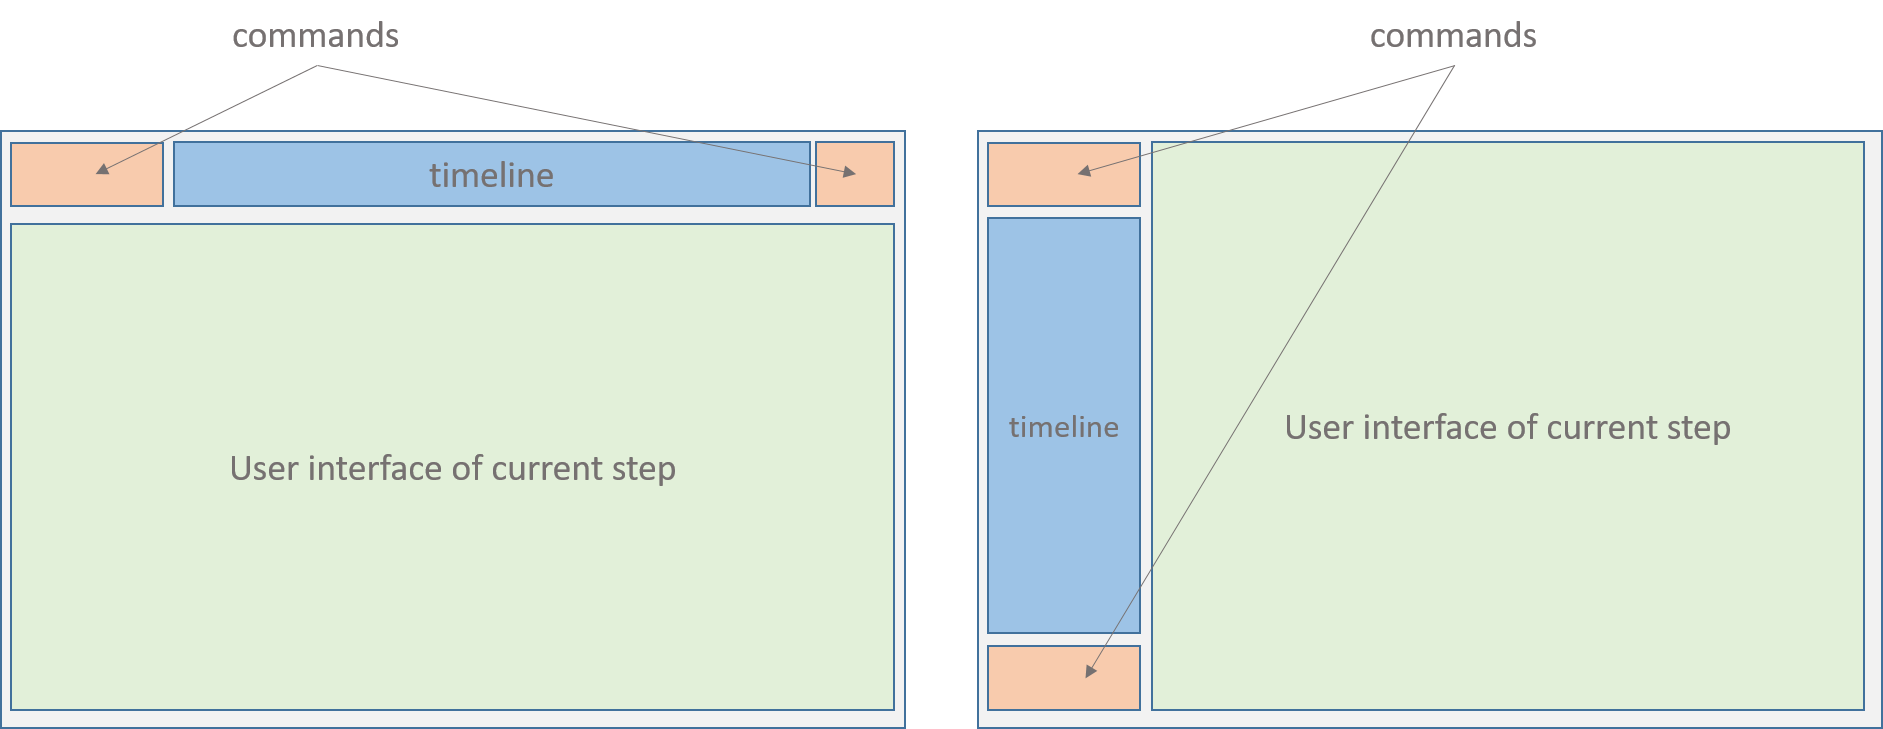
- Horizontal layout, (b) Vertical layout
Note that in a pipeline timeline, the first step is still ‘Description’ and the last step is called ‘Save’, as it is the case for any process timeline. The ‘Save’ is technically not necessary as there is already a ‘Save’ step in the last process. Thus, when the user save its work in the last process of the pipeline, this will automatically save the whole object and return it to the caller program.
Rules of navigation
Several rules are applied to guarantee the global strategy of the workflow and the quality of the analysis process. This point is important to understand the possibilities of navigation with MagellanNTK.
When the application is launched, no dataset is loaded. Consequently, all pipelines, processes, and steps remain disabled until a dataset is provided. Once a dataset is loaded, it is passed to the pipeline and the analysis can begin.
Start workflow at the beginning.
At the beginning, the first step (‘Description’) is the only one
enabled. This guarantees to always start from the first step. In the
timeline of the pipeline, the Description step is marked as VALIDATED
because the dataset already contains some information from the ‘Convert’
process.
One way direction. Tasks are executed sequentially in a single direction, from the first to the last.
A task operates on the most recent SE in the dataset. As the results of tasks are stored (SE) in the dataset in the order they have been produced, the tasks are run over the last SE of the dataset. When a task produces a new results (SE), it is appended to the end of the dataset (MAE).
Run tasks once. Once a task has been validated, it is marked as DONE and becomes DISABLED. This feature guarantees that the user cannot run the same task multiple times on a SE. The only possibility is to reset the task to restart it. (see xxx).
Validating a task. When a task is validated, its state becomes disabled and all further tasks until the next mandatory one are automatically enabled.
Enabled/disabled tasks. A task is marked as ENABLED because a rule allow it to be executed at this time. This happens when:
- There is a previous task marked as VALIDATED and there is no MANDATORY and UNDONE task between them.
- A dataset has been loaded in MagellanNTK.
Reset action. Regardless of whether we consider a pipeline or a process, the ‘Reset’ strategy is the same. Only the current task can be reset. Resetting the current task also reset all further tasks. This feature ensures the tasks are processed only once. When a task is reseted (the current and any further one), several actions are done: * the dataset is reseted to its initial state at the beginning of the task. Typically, it will only contain the results of previous validated tasks. * The UI of the task is re-enabled. * The widgets go back to their default values.
Reset a sub-step of a process. This is not implemented The only possibility is to reset the whole process.
Reset a process. This can be done by clicking on the Reset button in the command panel of the process.
Reset an entire pipeline. * In the pipeline command panel, there is no ‘Reset’ button. To reset a pipeline, the user goes back to the first step (by clicking enough times on the ‘Prev’ button or by clicking on the ‘Go back to start’ button). then, switch to the command panel of the first task (on the vertical timeline) and click on the Reset button.
Navigation between steps. It is always possible to navigate between all the steps event if they are disabled. This feature is useful if one wants to see/discover the content of next steps or to remind the values set in the previous widgets.
Example (PipelineDemo) step by step
In this section, we describe how to use a pipeline workflow. As for the process workflow, this is a step-by-step guide in which you will switch between lessons about the interface and practice.
Overview
The ‘PipelineDemo’ example pipeline is provided with the
MagellanNTK package. Its code is stored in the folder
‘inst/workflow/PipelineDemo’. It contains three data processing
steps:
- DataGeneration: creates a dataset using two Gaussian distributions.
-
Preprocessing: contains two sub-steps:
- Filtering: filter the rows based on the average or sum of their values.
- Normalization: normalize the columns using the sum or average of the values in the column.
- Clustering: cluster the data in order to identify the two Gaussian distributions used to generate it.
Note that the ‘Description’ and ‘Save’ steps are not strictly speaking data processing steps. The description step displays the contents of a file in the workflow directory and allows you to view information about the pipeline. The last step, ‘Save’, allows you to directly access the module for downloading the processed dataset (the same as if you went through the “Save as” sidebar).
Starting the pipeline
‘PipelineDemo’ can be launched by typing the following command in a R console:
library(MagellanNTK)
wf.path <- system.file('workflow/PipelineDemo', package = 'MagellanNTK')
MagellanNTK(wf.path, 'PipelineDemo')
This will open a new tab in your default web browser with this url: http://127.0.0.1:3838
General user interface
The user interface consists of two parts (Fig. @ref(fig:menuSidebar)): the sidebar on the left and the main screen.
- Sidebar on the left containing the general menus.
- Main part that displays the workflow manager.
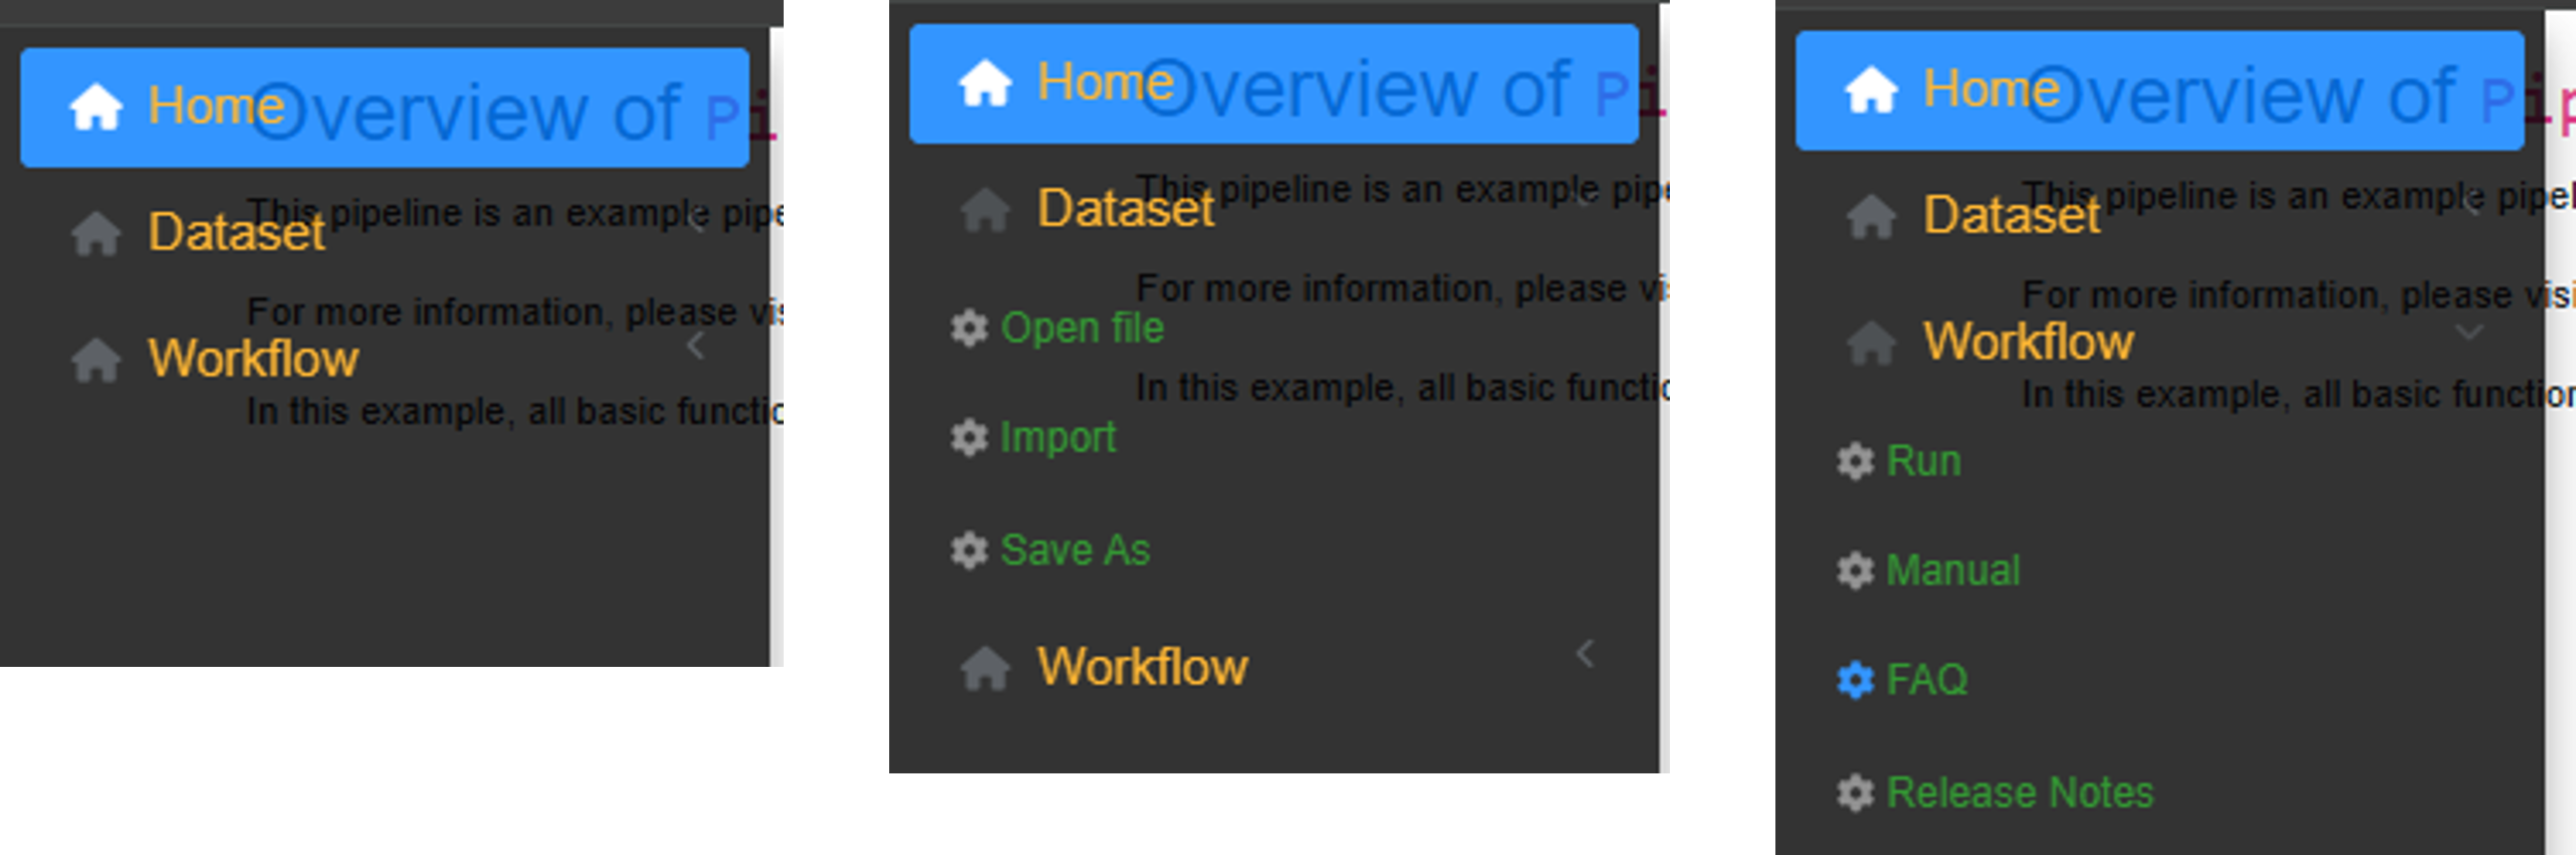
General menu of MagellanNTK (retractable sidebar)
Sidebar menu. The sidebar contains the main menus. It expands when the mouse hovers over it and retracts otherwise. The different menus are as follows:
Home: provides general information about MagellanNTK. By default, content is minimal.
-
Dataset:
- Open file: allows you to select a dataset to work on.
- Import: allows you to convert a results file into a format compatible with MagellanNTK.
-
Save as: displays the module called
download_dataset, which allows to export the current dataset. The native MagellanNTK module allows exporting in .rdata format. This module is one of the configurable modules.
-
Workflow:
- Run: displays the data manager interface. This interface is displayed even if there is no dataset, but at that point, all widgets are disabled. They are enabled according to the logic implemented in this manager.
-
FAQ: opens an Rmd file for FAQ for the current
pipeline. This file must be stored in the
mddirectory within the folder of a pipeline. - Manual: displays the user manual for the current pipeline.
- Release notes: displays the release notes file for the current pipeline.
Main screen The interfaces linked to the menu items are displayed in the main screen. Specifically, the data manager will be displayed in this main section. More details are provided later in this document. This display is visible when you click on the Workflow/Run sidebar menu. At this stage of the document, as no dataset has been loaded yet, all workflow interfaces are disabled. However, the user can still navigate in the pipeline to discover the various processes and parameters available.
The user interface provided by MagellanNTK allows to work with processes and pipelines as well. Thus, the interfaces for processes and pipelines are very similar and share a lot of features. For this reason, this section mainly focuses on a process workflow. Describing more complex structures will be easier.
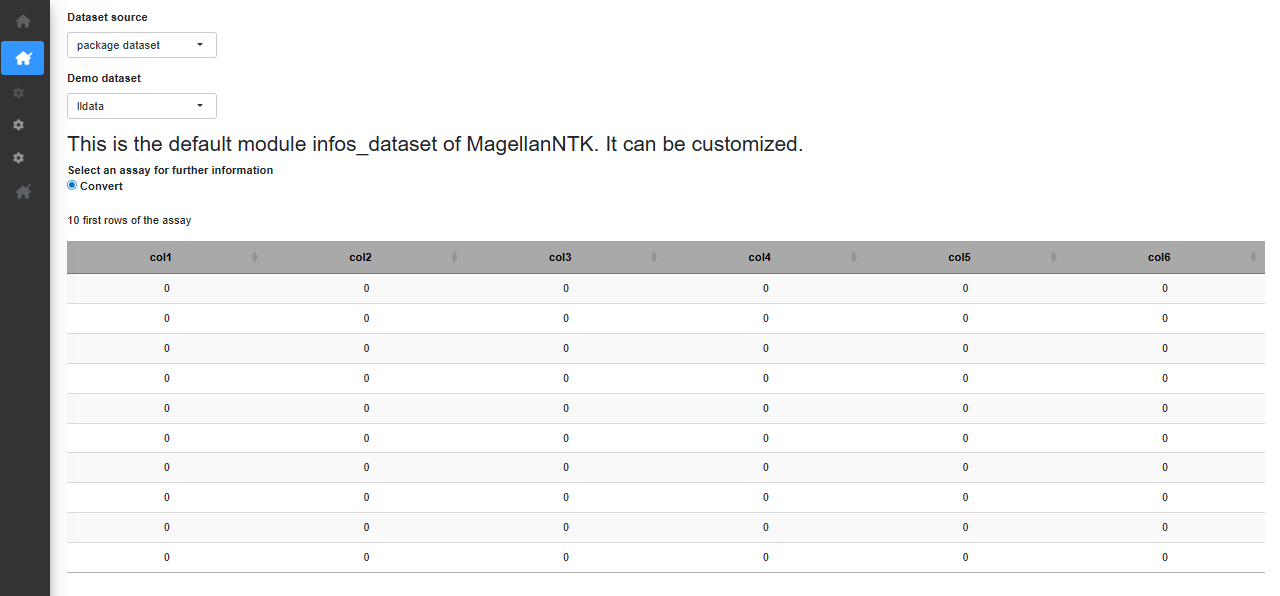
Open a dataset
When the application opens, no dataset is loaded. To load one, hover
over the sidebar menu and go to “Dataset” -> “Open file”. If you
haven’t exported a dataset from MagellanNTK yet, select the “package
dataset” option in “Dataset source” to choose one of the datasets
included in the MagellanNTK package. For this tutorial, we
select the ‘lldata’ dataset which consists of one SE containing an empty
100 x 6 matrix as assay. Once a dataset is chosen, a short summary of
the dataset is displayed (Fig. @ref(fig:opendataset)).
opendataset
Pipeline user interface
To access the workflow, hover over the sidebar menu and go to “Workflow” -> “Run”.
In the main screen, one now view the complete pipeline interface. On the top of the screen, one recognize the pipeline timeline with the steps of the pipeline and a commands panel with 3 buttons.
commands: shows a panel containing five buttons which allow to interact and navigate through the different steps of the process: * Back to start As we will see later in the document, pipelines have only three commands : the already-known ‘Prev’ and ‘Next’, which have the same function for a process or a pipeline, and another commands called ‘Back to start’ which set the first step of a pipeline as the current one (the underline goes under its name).
Previous. A click on the ‘Prev’ button moves the cursor in the timeline backward to enables the previous step. If the current step is the first one, then the previous button is disabled.
Next. Clicking on the ‘Next’ button moves the cursor in the timeline forward to select the next step. If the current step is the last one, then the next button is disabled
To navigate between processes, use the arrow on the left of the top timeline. The double arrow to the left of the left arrow allows you to return with one click to the very first process (Description) from any process of the workflow. To navigate inside a process, use the arrow in the left sidebar, above the vertical timeline showing the different step available.
Even if a step is disabled, it is possible to view the content of it. At any point during the workflow, the “EDA” button at the top right provides access to the previously described summary as well as a complete history of the parameter values used in previously validated processes.
Below that header, there is the interface of the current process/step (the one that have the cursor under its name in the pipeline timeline). The process UI is divided into two parts (Fig. @ref(fig:UIsingleProcess)).
- A sidebar on the left which is always visible.
- All remaining space to show results (tabs, plots and any other stuff).
The content of this part is updated each time the user changes the current process.
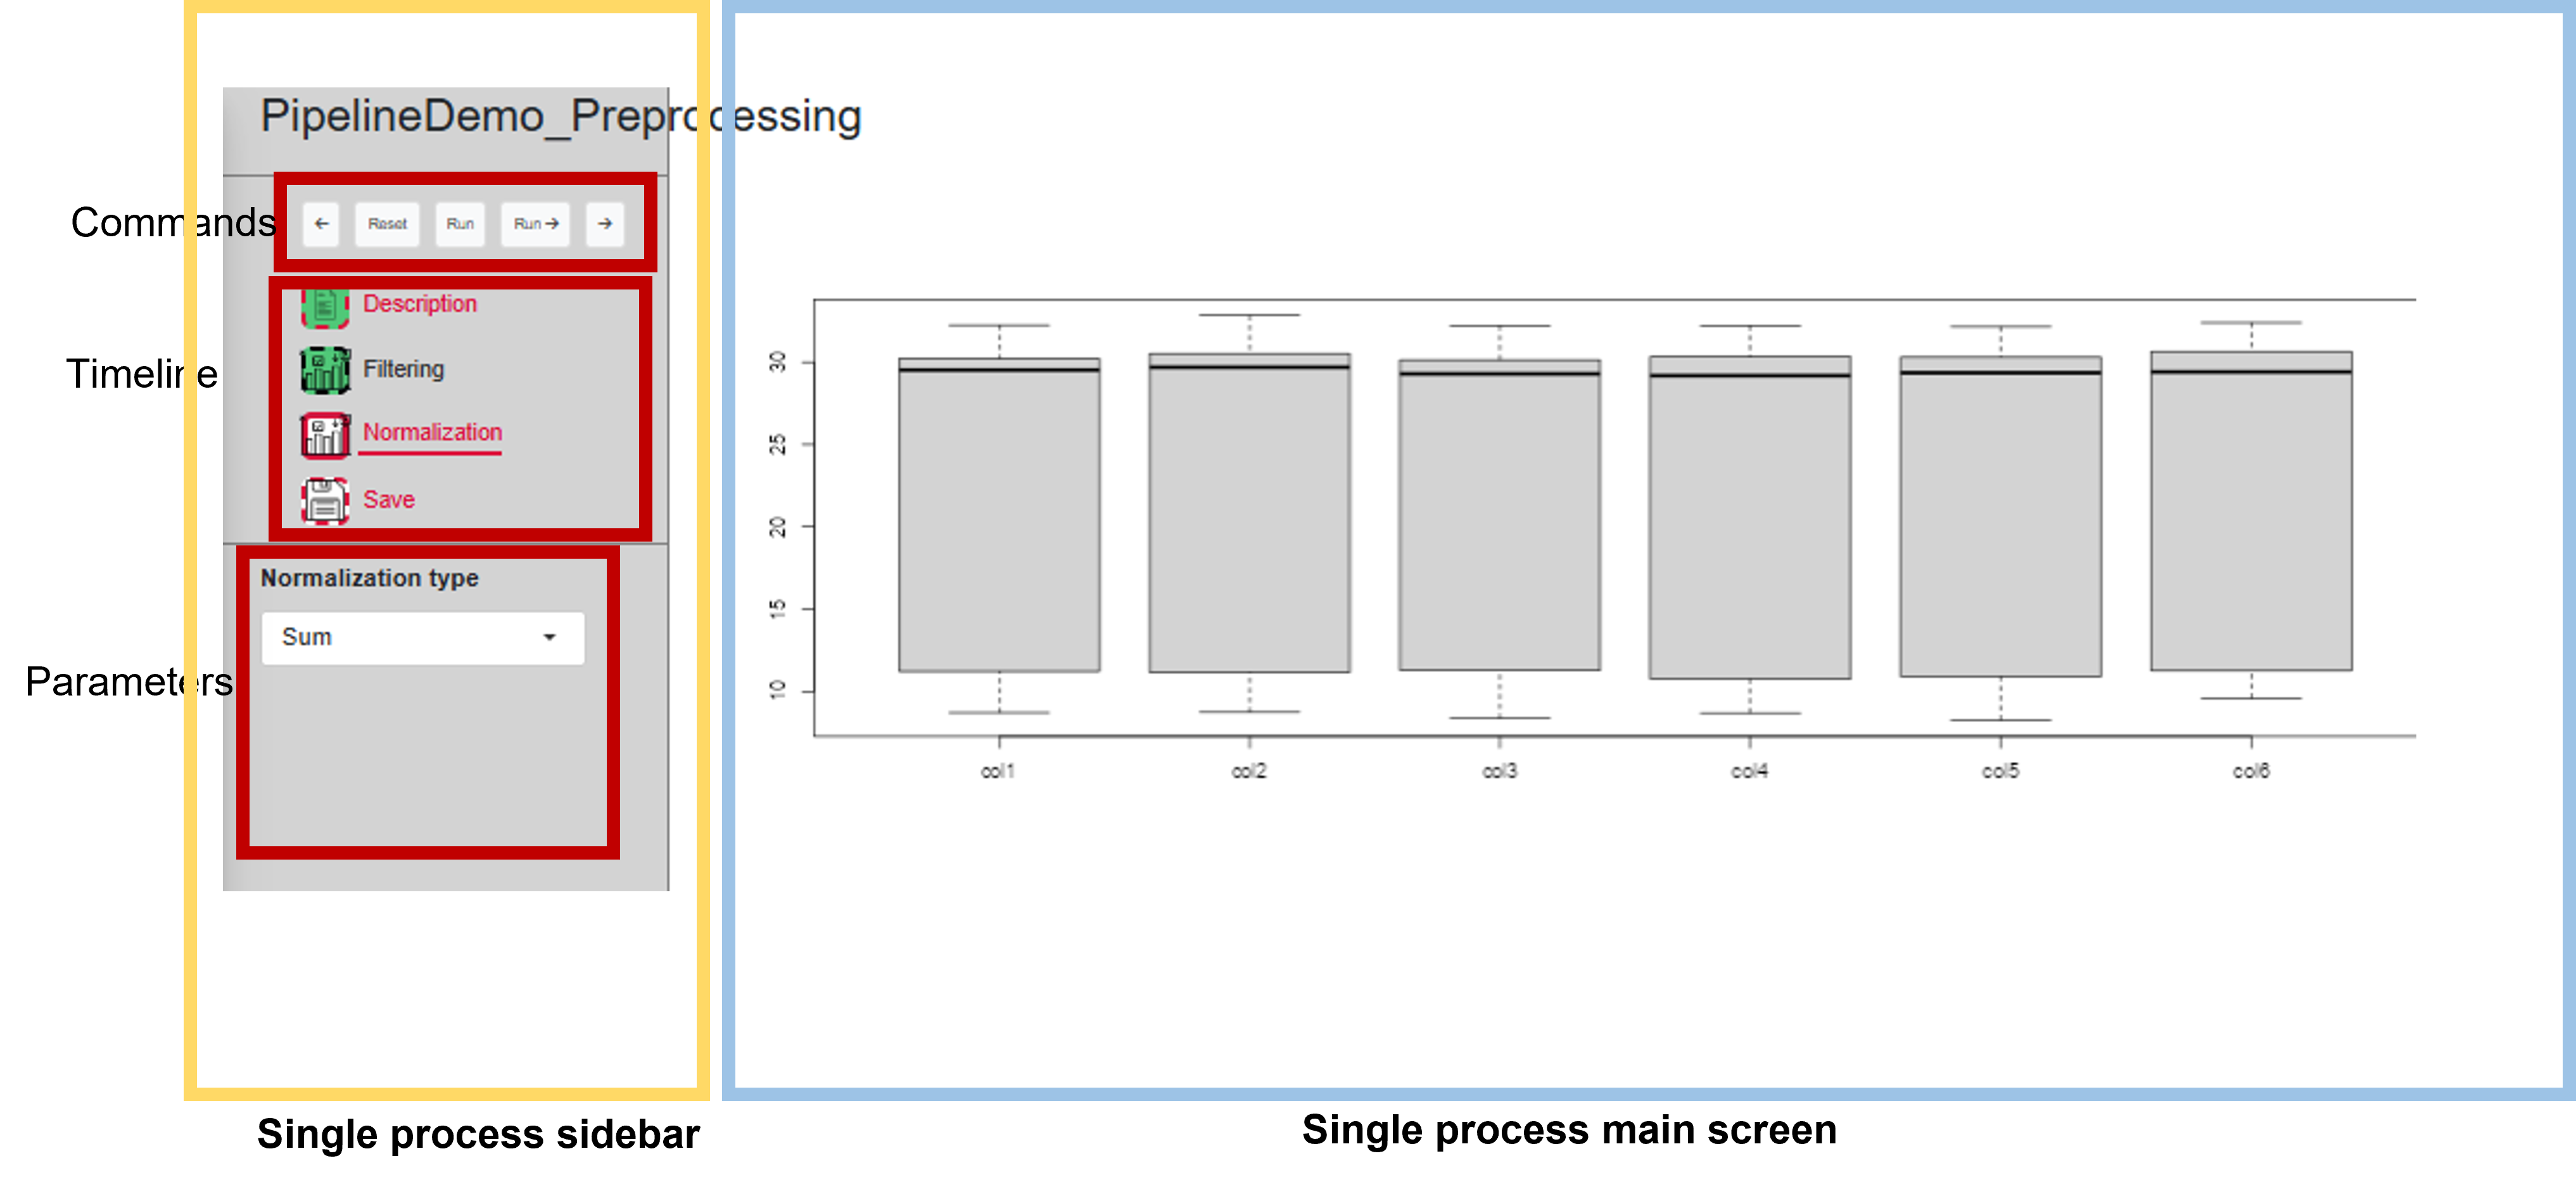
UI for a single process
Sidebar of a process
The sidebar itself always consists of three regions: commands, timeline and parameters.
commands: shows a panel containing five buttons which allow to interact and navigate through the different steps of the process: * Previous. A click on the ‘Prev’ button moves the cursor in the timeline backward to enables the previous step. If the current step is the first one, then the previous button is disabled.
-
Reset. This button is used to reset the entire process (all its steps) to its initial state. Several actions follow:
- The dataset that has been loaded in the process is kept.
- All the analysis that may have been done are deleted. Thus, the bullets in the timeline go to the ‘UNDONE’ state, no matter what their state is at the moment the Reset button is clicked.
- The current step becomes the first one (the cursor in the timeline goes under the first step).
- All the widgets in each step are set to their initial values and become disabled (until a dataset is launched in the process).
Run. This action performs the analysis with the selected parameters. If there are no sufficient parameters to perform the analysis, no analysis is done and a modal info is displayed and invite the user to adjust the parameters. Once the action has been done, the bullet in the timeline changes its state and pass to ‘DONE’. After this calculation, the current step stay unchanged to allow the user to view the result of its action on the dataset. This button is disabled if the current step is disabled (DONE or SKIPPED).
Run and Proceed. This is the same as the “Run” button but if the calculation succeeded, the current step automatically goes to the next step. This method is quicker than the previous one but has the disadvantage that the user can not immediatly view the results and has to click on the ‘Prev’ button to do so.
Next. Clicking on the ‘Next’ button moves the cursor in the timeline forward to select the next step. If the current step is the last one, then the next button is disabled
timeline which represent the sequence of tasks composing the process, placed in the order they can be executed (from top to bottom).
Parameters of the current step. In this part of the sidebar are displayed the parameters corresponding to the current step. They are enabled or disabled whether the sate of their step: * if the step is disabled (resp. enabled), the widgets are disabled (resp. enabled). * If the bullet of a step is enabled then all the widgets of this step are enabled (as well as the Run buttons). In the contrary, a bullet that is disabled means that all the widgets and the ‘Run’ buttons in the UI are disabled.
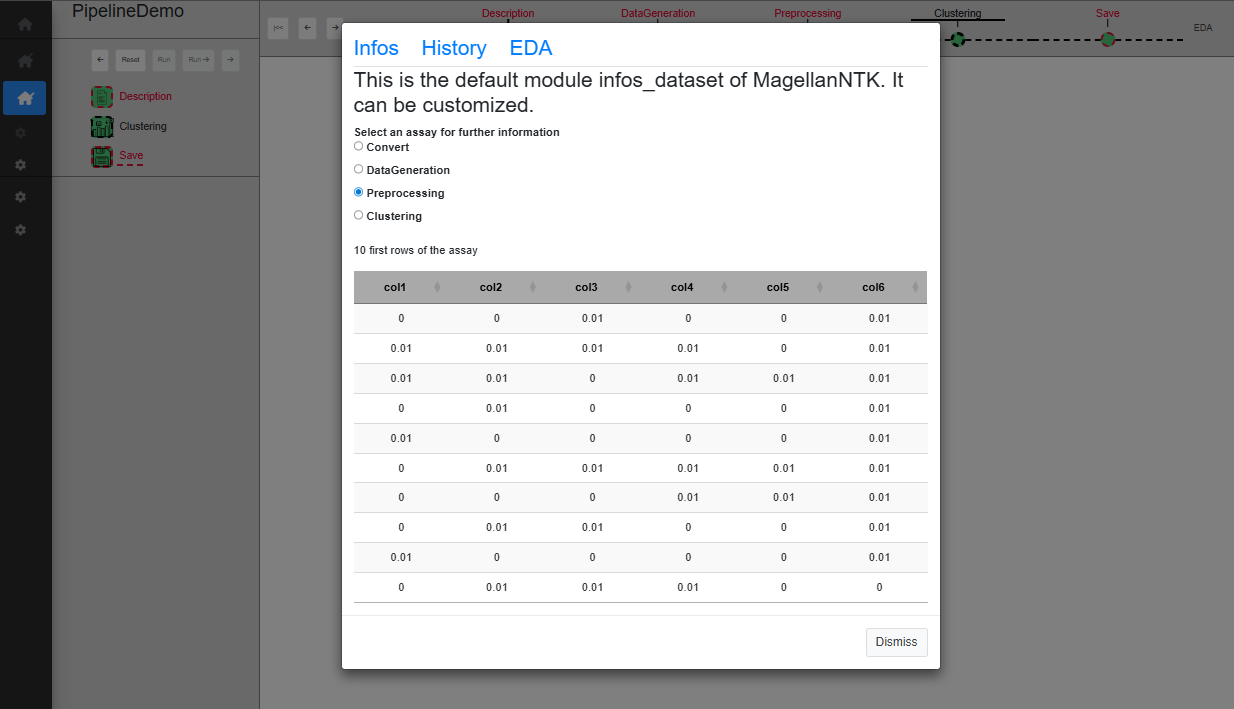
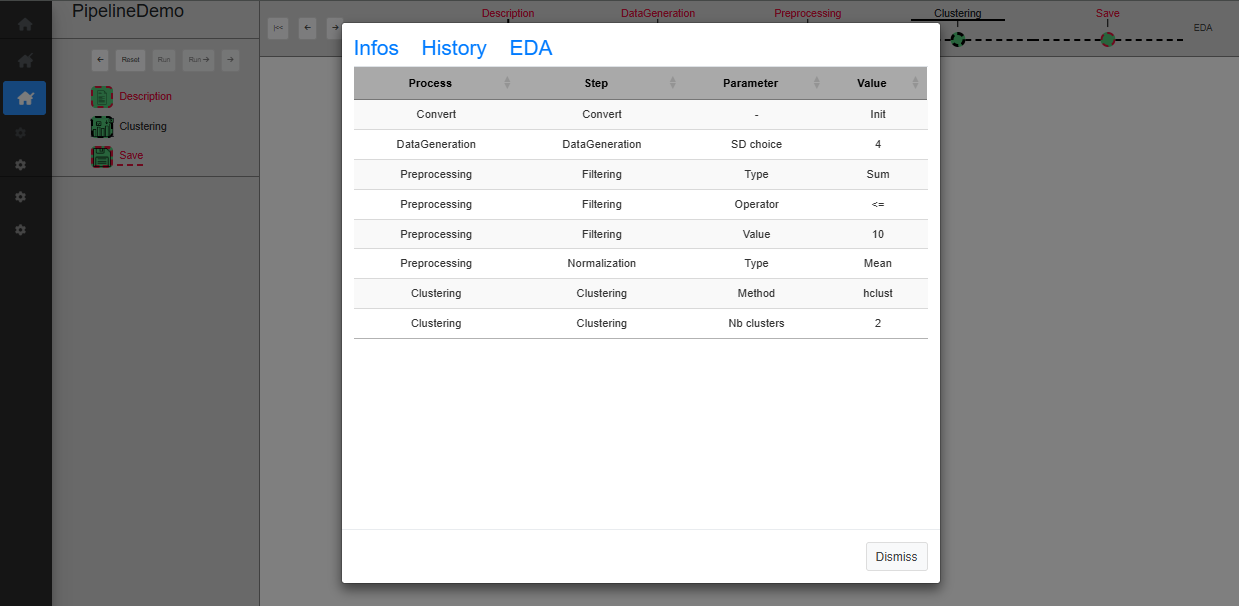
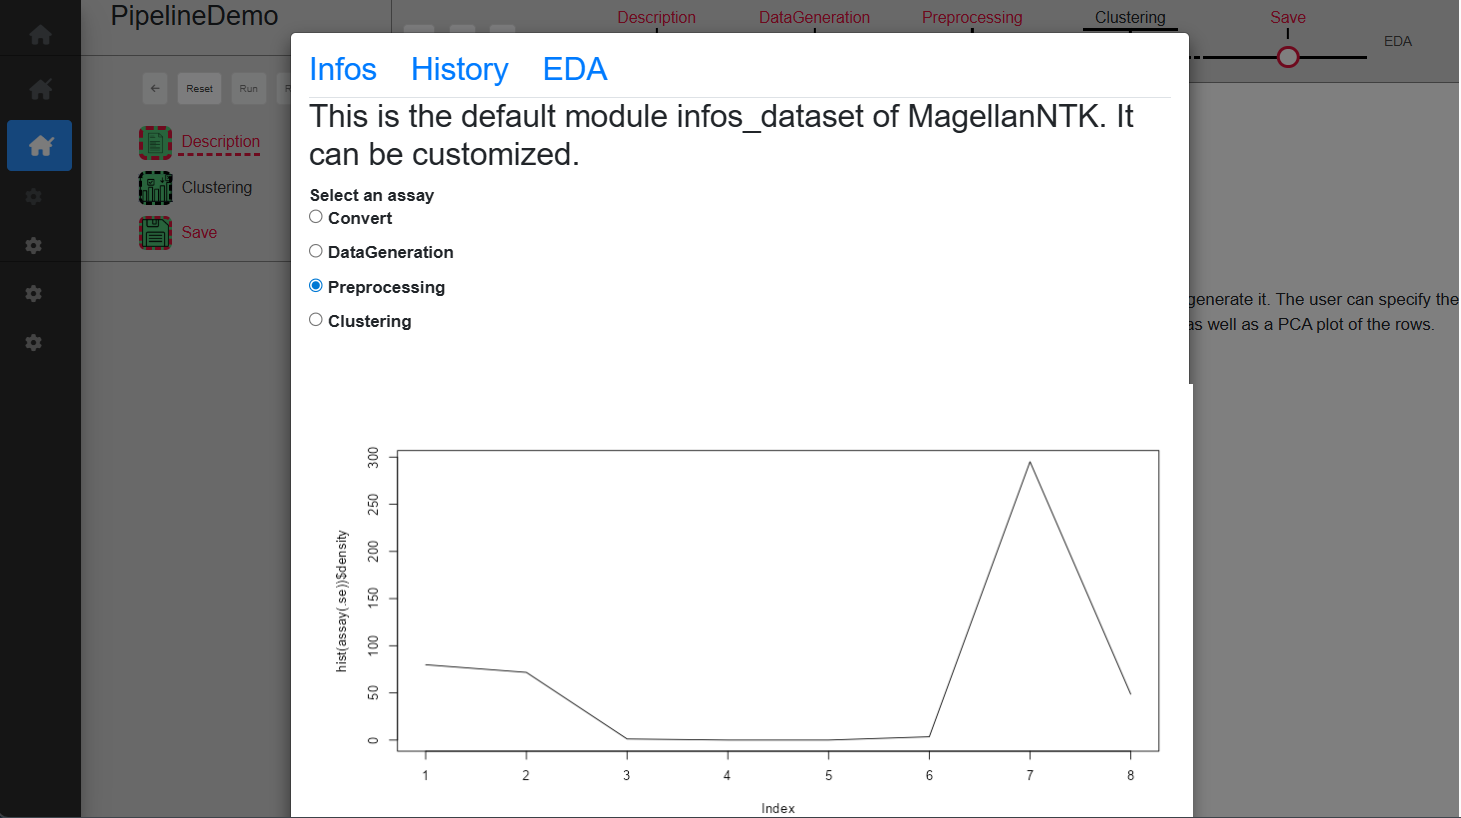
Exploratory Data Analyzer (EDA)
This tool is available when the user clicks on the link (named EDA), at the top right corner of the screen. This will open a modal window which proposes 3 tabs, The content of each of them corresponding to a customizable module by means of “generic functions” (See ‘Inside MagellanNTK’). The examples in Fig. @ref(fig:pipelinedescription) show the result of default implementation of these 3 functions.
UI for a single process
UI for a single process
UI for a single process
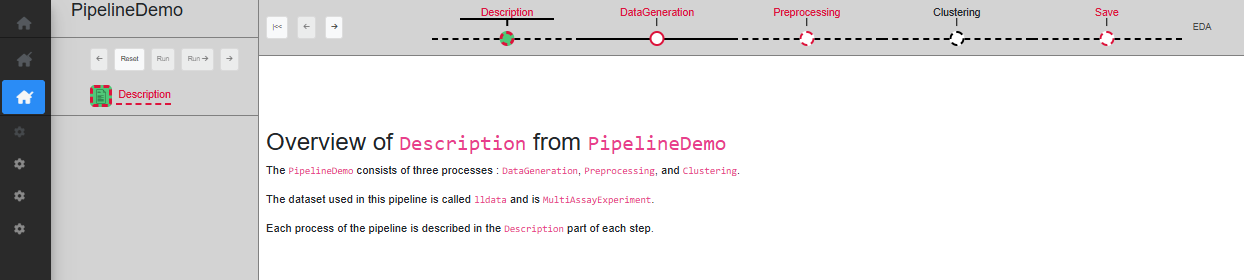
‘Description’ step
The first step is ‘Description’, which only serves as a starting point, with a short text describing the pipeline. When a dataset is loaded, this step is automatically validated (Fig. @ref(fig:pipelinedescription)).
pipelinedescription
At this point, the only action is to click ‘Next’ in the timeline of the pipeline so as to change the current step to ‘Data Generation’.
‘DataGeneration’ step
The first actual step is ‘DataGeneration’. This step is set as mandatory, so all subsequent processes are disabled until this step is validated. Like all other processes (with the exception of the Description at the beginning of the workflow, and Save at the end), it begins with a Description sub-step and ends with a Save sub-step. There is only one sub-step in this step, called ‘DataGeneration’. As the whole step is mandatory and contains only one step, the sub-step ‘DataGeneration’ has to be set as mandatory as well.
The ‘Description’ sub-step serves as a starting point of the process, with a short text displayed describing the process function. The way this sub-step work is the same for every process, with only the text content being different.
The ‘DataGeneration’ sub-step creates a dataset using two Gaussian distributions. The user can specify the sd to use for these Gaussian distributions and a table allows to preview the dataset once created. Once a choice on the sd has been made, you can click on ‘Run’ to validate and see the created dataset displayed on the table (Fig. @ref(fig:datageneration3)), or ‘Run ->’ to directly skip to the save sub-step.
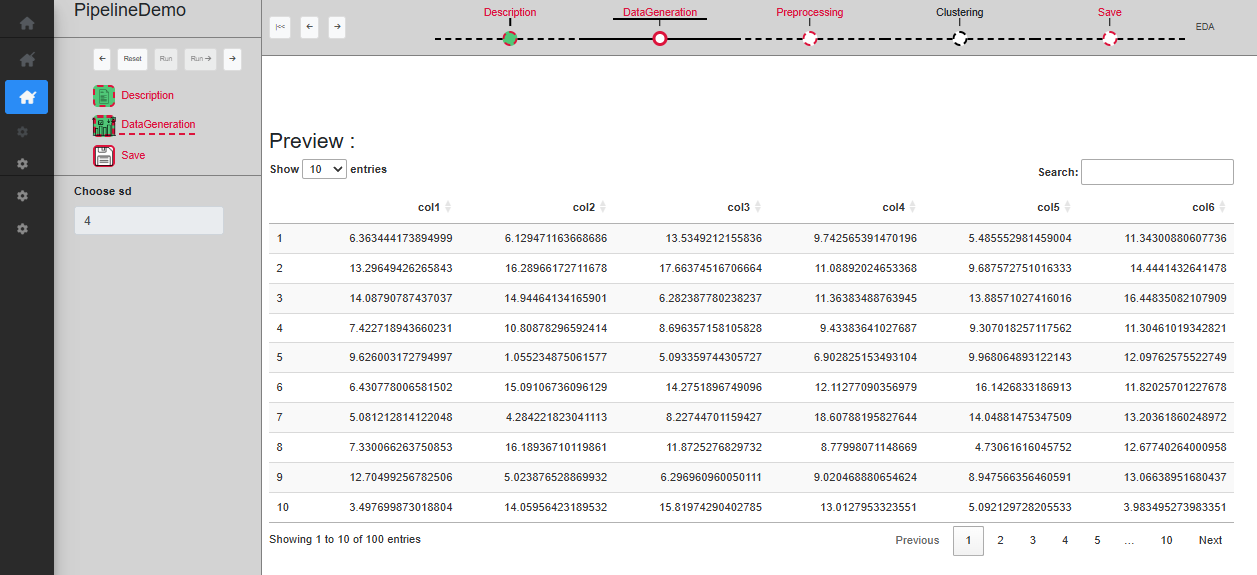
Step Data generation
The ‘Save’ sub-step allows to validate the whole process. A new SE is created in the dataset, which can be noticed by clicking on EDA. You can then go to the next step. The history is also updated with new informations. Note that the ‘Run ->’ button is disabled as it is the last sub-step.
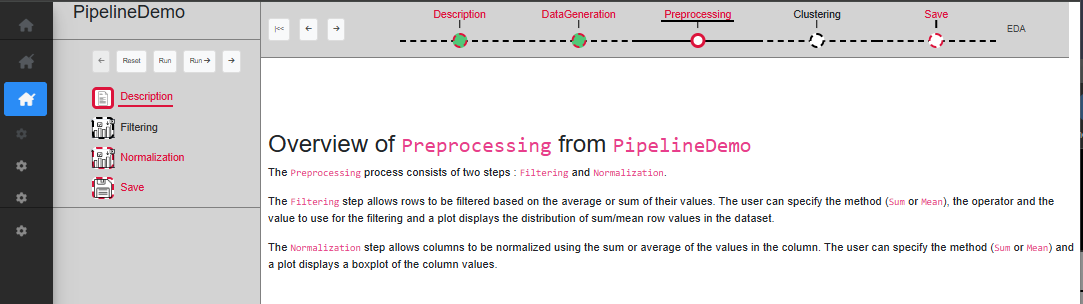
‘Preprocessing’ step
The second step is ‘Preprocessing’. This step is set as mandatory, so all subsequent processes are disabled until this step is validated. There is two sub-step in this step: ‘Filtering’ and ‘Normalization’. While the whole step is mandatory, only the ‘Normalization’ sub-step is mandatory. It is possible to skip the ‘Filtering’ sub-step.
The ‘Filtering’ sub-step allows rows to be filtered based on the average or sum of their values. The user can specify the method (Sum or Mean), the operator and the value to use for the filtering and a plot displays the distribution of sum/mean row values in the dataset. Once a choice of parameters has been made, you can click on ‘Run’ to validate and see the filtered dataset on the plot, or ‘Run ->’ to directly skip to the next sub-step (Fig. @ref(fig:UIPipelineDemoPreprocessing2)). As this sub-step is not mandatory, if the next one is validated while ‘Filtering’ is not, it will become disabled.
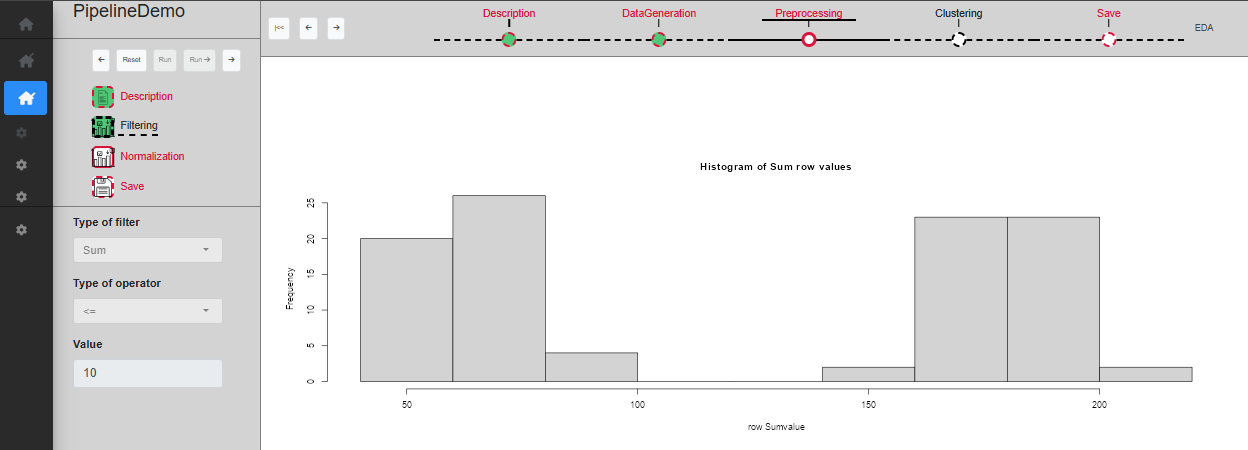
Sub-step Preprocessing/Filtering
The ‘Normalization’ sub-step allows columns to be normalized using the sum or average of the values in the column. The user can specify the method (Sum or Mean) and a plot displays a boxplot of the column values. Once a choice of parameters has been made, you can click on ‘Run’ to validate and see the normalized dataset on the plot (Fig. @ref(fig:UIPipelineDemoPreprocessing3)), or ‘Run ->’ to directly skip to the next sub-step.
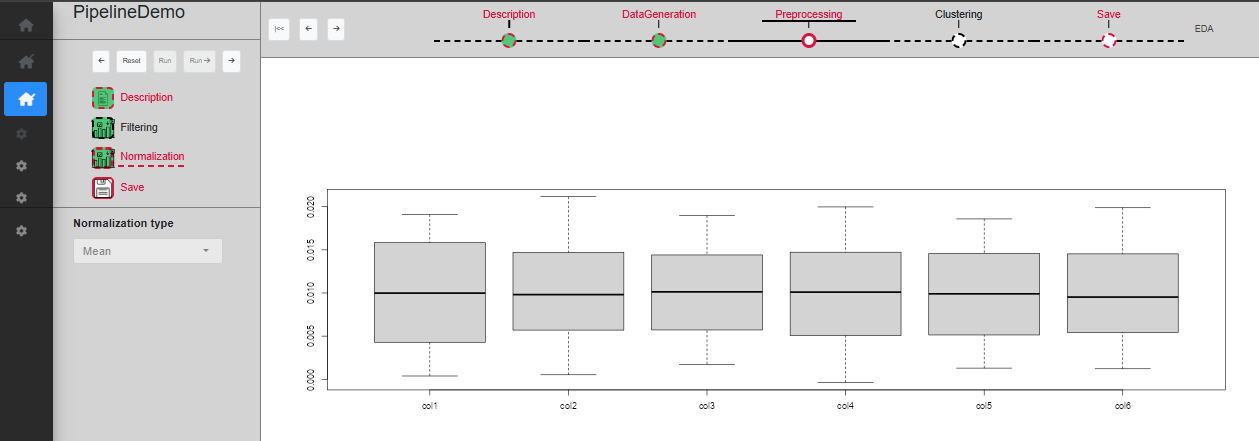
Sub-step Preprocessing/Normalization
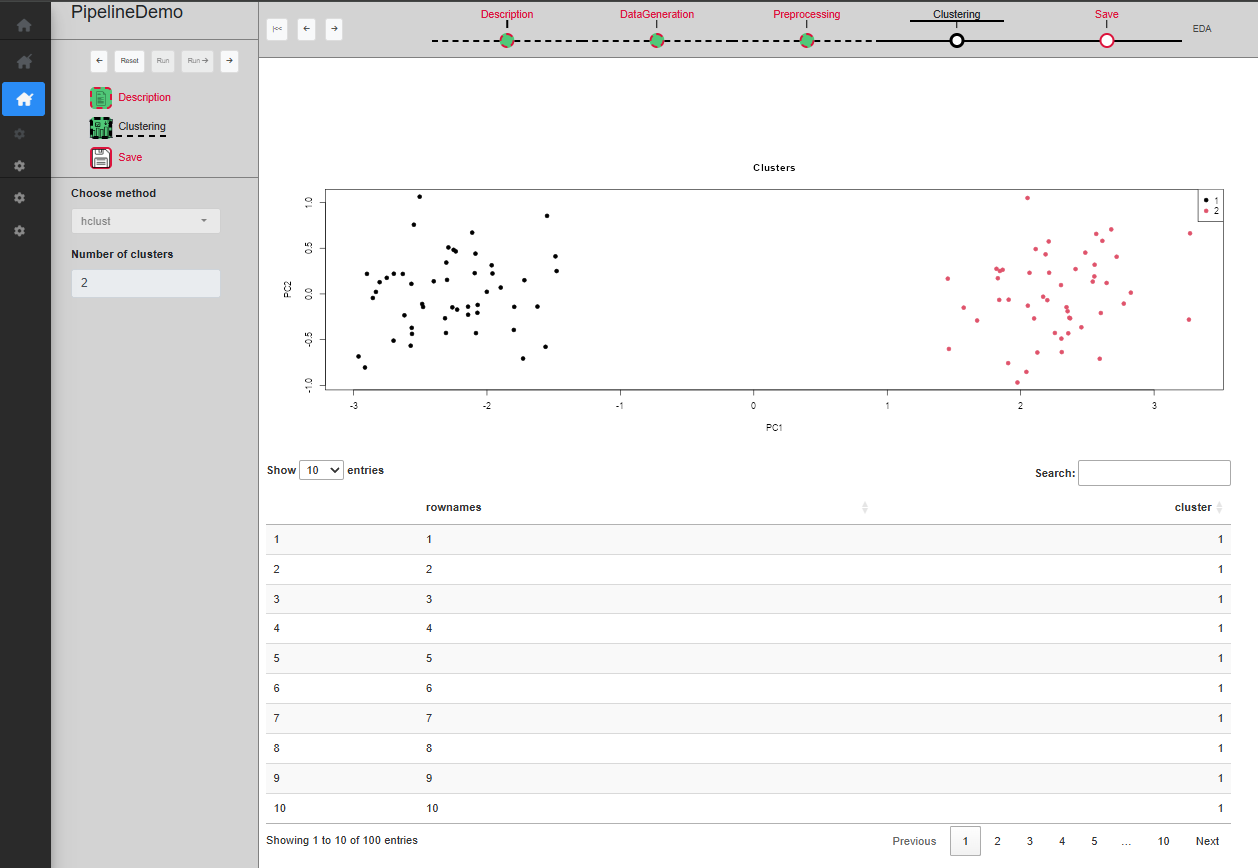
‘Clustering’ step
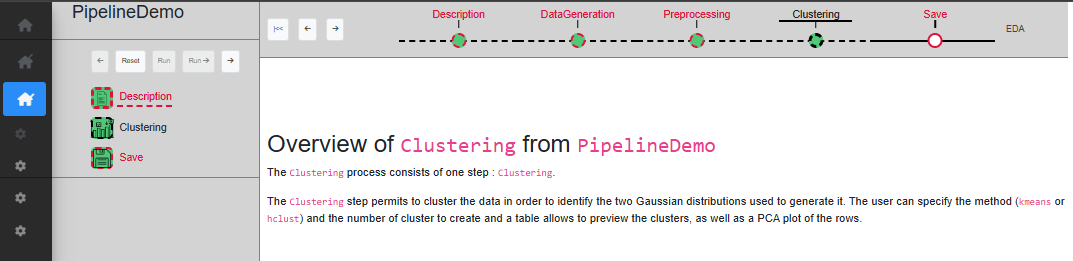
The third and last actual step is ‘Clustering’. This step is not mandatory and can be skipped. There is only one sub-step in this step, called ‘Clustering’.
The ‘Clustering’ sub-step permits to cluster the data in order to identify the two Gaussian distributions used to generate it. The user can specify the method (kmeans or hclust) and the number of cluster to create and a table allows to preview the clusters, as well as a PCA plot of the rows. Once a choice of parameters has been made, you can click on ‘Run’ to validate and see the filtered dataset on the plot (Fig. @ref(fig:UIPipelineDemoClustering2)), or ‘Run ->’ to directly skip to the next sub-step.
Sub-step Clustering/Clustering
Reset a step
If at any point a mistake was made in the chosen parameters, or you simply want to try something else, you can reset any process with the ‘Reset’ button. Resetting a process means that the process in question, as well as any other process down the timeline, will be resetted with default values and all SE from these processes will be removed. It means that the dataset will be set to its initial value as if it is the first time the user start this process (Fig. @ref(fig:resetastep)).
Keep in mind that this is irreversible, and therefore if the reset was done by mistake, you will have to start again from this point.
Reset a process
Reset a process
It is possible to quickly reset the whole pipeline by clicking on the ‘Go back to start’ button (in the command panel of the pipeline). The current process becomes the first one ‘Description’ and then, click on the ‘Reset’ button of this process. All the processes of the pipeline will be reseted in one action.
Run a single process
If one wants to run only a single process, MagellanNTK implements the ability to launch and run it rather than launch the whole pipeline and move to the correct process. Another advantage of this feature is the gain of time it offers when developing (and debugging) a new process for this pipeline.
To launch a process, the command lines are quite similar to those for launching a pipeline; one just have to specify the name of the process to run. In the following example, one launch the process ‘Preprocessing’:
library(MagellanNTK)
wf.path <- system.file('workflow/PipelineDemo', package = 'MagellanNTK')
MagellanNTK(wf.path, 'PipelineDemo_Preprocessing')
This also opens the MagellanNTK framework in the default web browser. The only difference with running a pipeline is the absence of the pipeline timeline on the top of the screen. All other UI components stay available.
An important point here concerns the dataset. As this feature has
been implemented to quickly test new data analysis tool, it has been
decided to simplify the dataset the user will analyze with this process.
Thus, after loading of a dataset, MagellanNTK delete all the SE stored
in the dataset but the last one. The result is a new instance of
MultiAssayEpxeriment with only one assay
(SummarizedExperiment) renamed ‘Convert’ and which
corresponds to the last assay of the real dataset.
As an example, consider the dataset ‘lldata12’ from the package
MagellanNTK which has 3 SE: ‘Convert’, ‘DataGeneration’ and
‘Preprocessing’. If one load this dataset in a single process, then
MagellanNTK will create a new dataset containing only the ‘Convert’
assay which is a renaming of the previous ‘Preprocessing’ assay.
Session information
## R version 4.5.2 (2025-10-31)
## Platform: x86_64-pc-linux-gnu
## Running under: Ubuntu 24.04.3 LTS
##
## Matrix products: default
## BLAS:   /usr/lib/x86_64-linux-gnu/openblas-pthread/libblas.so.3
## LAPACK: /usr/lib/x86_64-linux-gnu/openblas-pthread/libopenblasp-r0.3.26.so;  LAPACK version 3.12.0
##
## locale:
##  [1] LC_CTYPE=C.UTF-8       LC_NUMERIC=C           LC_TIME=C.UTF-8
##  [4] LC_COLLATE=C.UTF-8     LC_MONETARY=C.UTF-8    LC_MESSAGES=C.UTF-8
##  [7] LC_PAPER=C.UTF-8       LC_NAME=C              LC_ADDRESS=C
## [10] LC_TELEPHONE=C         LC_MEASUREMENT=C.UTF-8 LC_IDENTIFICATION=C
##
## time zone: UTC
## tzcode source: system (glibc)
##
## attached base packages:
## [1] stats     graphics  grDevices utils     datasets  methods   base
##
## other attached packages:
## [1] BiocStyle_2.38.0
##
## loaded via a namespace (and not attached):
##  [1] digest_0.6.39       desc_1.4.3          R6_2.6.1
##  [4] bookdown_0.46       fastmap_1.2.0       xfun_0.56
##  [7] cachem_1.1.0        knitr_1.51          htmltools_0.5.9
## [10] rmarkdown_2.30      lifecycle_1.0.5     cli_3.6.5
## [13] sass_0.4.10         pkgdown_2.2.0       textshaping_1.0.4
## [16] jquerylib_0.1.4     systemfonts_1.3.1   compiler_4.5.2
## [19] tools_4.5.2         ragg_1.5.0          bslib_0.10.0
## [22] evaluate_1.0.5      yaml_2.3.12         BiocManager_1.30.27
## [25] otel_0.2.0          jsonlite_2.0.0      rlang_1.1.7
## [28] fs_1.6.6            htmlwidgets_1.6.4